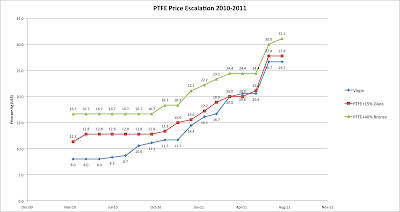
While much has been said about the causes and implications of the PTFE price escalation, we felt it necessary to go through our archives and chart out the exact extent to which the prices have changed.
The chart below shows the price per Kg in US$ for three standard grades – Virgin PTFE, Glass Filled PTFE (15%) and Bronze Filled PTFE (40%). In addition, we have included a table showing the total and monthly growth in prices.
Needless to day, the growth has been unprecedented. In Virgin PTFE, a nearly 8% increase in prices every month has put the industry in a state where there is no breathing time between processors getting new pricing information and passing on that information to the customers.
Most processors are well aware of the effect this has had on their businesses. The main issue has been convincing customers regarding the price increase and furthermore making them aware that the trend may be expected to continue. In addition to this, there is the impact on repeat business, as clients withhold contracts which would have otherwise spanned their requirements over a full year – since processors are unable to commit to prices for more than a one month horizon.


